Data Pipeline
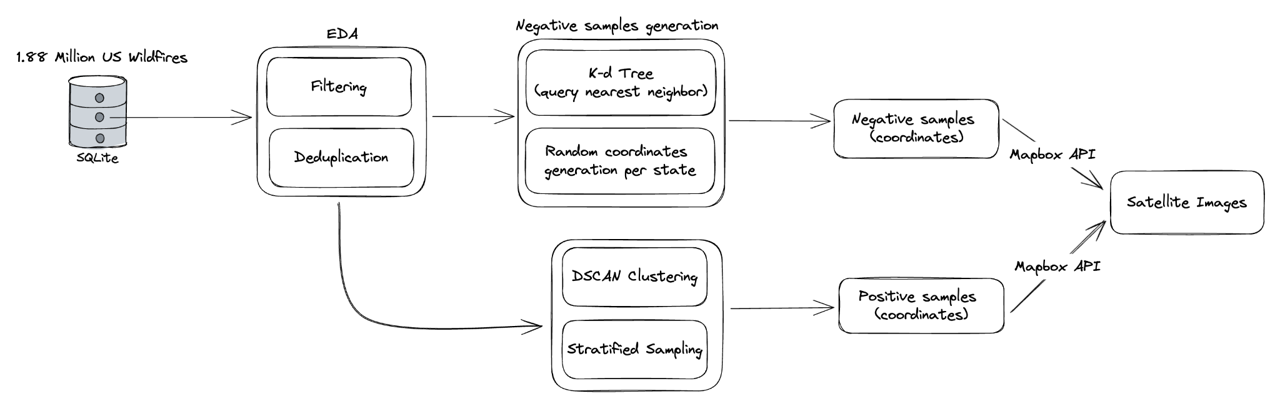
A data pipeline in machine learning is a systematic process that automates the collection, preprocessing, and transformation of data, ensuring its readiness for model training and evaluation. These pipelines improve data quality, consistency, and efficiency, making them indispensable for effective machine learning projects. The comprehensive workflow for this project is depicted below.
Exploratory Data Analysis
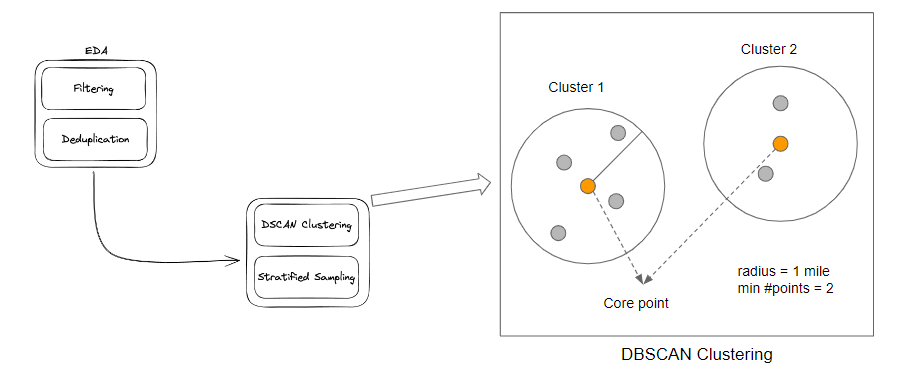
Initially, the 1.88 million wildfire dataset is deduplicated based on latitude, longitude, and datetime tuples. Subsequently, undesirable samples, such as those resulting from human activities like arson and campfires, are filtered out. Following these primary preprocessing steps, 1.55 million wildfire records remain. To optimize training efficiency and conserve computational resources, we employ DBSCAN (Density-based Spatial Clustering of Applications with Noise) to cluster wildfire records within a geographical proximity of 1 mile. Furthermore, we implement stratified sampling by state to further refine the dataset for model training.
Negative Samples Generation
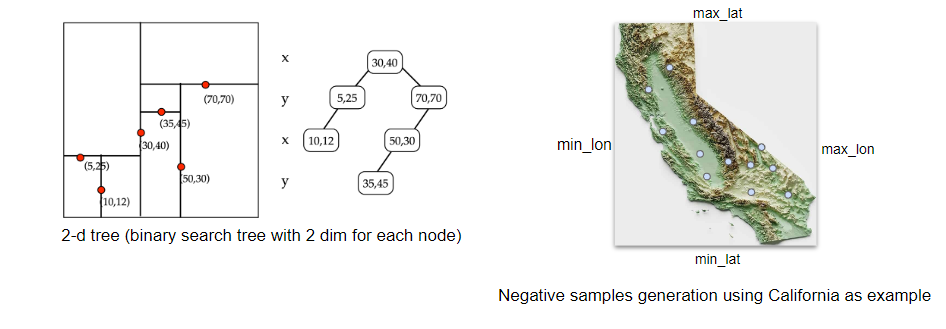
Given that the wildfire dataset exclusively comprises positive class instances, we manually generate negative samples' coordinates efficiently. Care is taken to ensure that these negative samples do not overlap with existing positive samples, achieved through the implementation of a k-d tree—a binary search tree with nodes possessing k dimensions or attributes. In our scenario, the k-d tree is constructed with 2 attributes: latitude and longitude.
Once the k-d tree is created, querying the nearest neighbor for a given coordinate only takes an average time complexity of O(log(n)). This implementation significantly reduces the time required to generate negative samples, transforming the process from hours to seconds.
The procedure to generate new coordinates involves three key steps, illustrated using California as an example. Initially, a coordinate is randomly generated within California's boundaries, defined by the minimum and maximum longitude (min_lon to max_lon) and latitude (min_lat to max_lat). Subsequently, the distance between the new coordinate and its nearest neighbor is computed by querying the k-d tree. If the distance falls within the 2-50 miles range, the new sample is deemed valid; otherwise, the generation process is repeated until a valid point is obtained. This iterative process is replicated for all U.S. states.
In the final stages, we utilize the Mapbox API to retrieve satellite images for both positive and negative samples, which collectively constitute the training data.
MVP Deployment Architecture
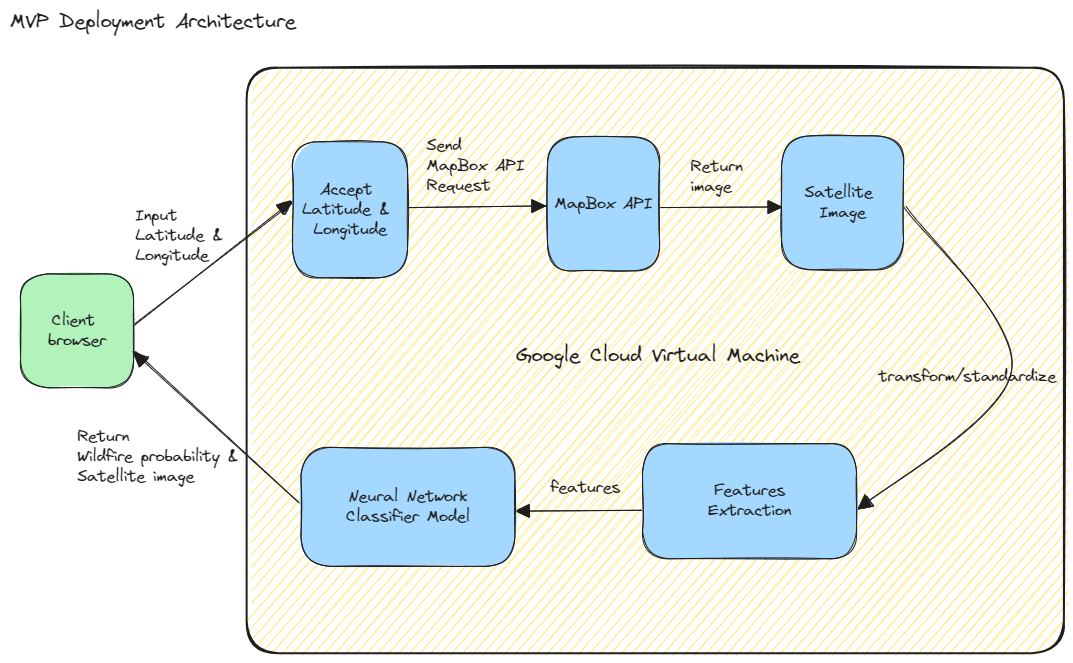
The diagram below outlines the MVP architecture of the wildfire probability prediction service.
- Firstly, the user picks a location on the interactive map in a client browser. The coordinate is represented as a latitude and longtitude pair. These latitude and longitude are sent to the Wildfire Prophet server running on the Google Cloud.
- The backend will then download the satellite image based on the coordinates through Mapbox API.
- Once the satellite image is retrieved, a z-score normalization is performed on the image using the mean and std of training data calculated in the training phase of the final model. This normalization process ensures model training and serving consistency. Furthermore, the image array is standardized to 0-255 range, which enhances the comparability and interpretability of pixel values across different images, and facilitates feature extraction.
- The Local Binary Pattern (LBP) feature is extracted from the processed image using OpenCV library. LBP features capture fine grained details and textures of the satellite image.
- Predictions are generated using the fitted Neural Network classifier model and the computed LBP features.
- Finally, the system returns the assessed wildfire probability along with the satellite image to the client browser for the user to view.
This MVP deployment architecture illustrates a streamlined, cloud-based solution for real-time wildfire risk assessment using satellite imagery and machine learning. The architecture is scalable and modular, allowing for enhancements like adding more sophisticated models or integrating additional data sources for improved accuracy.